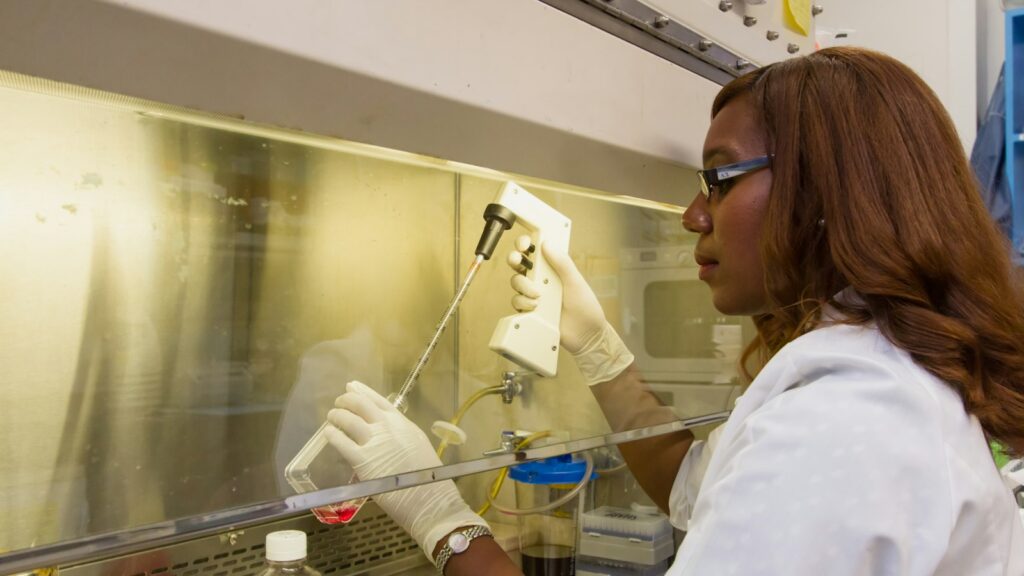
Michaelis Menten kinetics is the standard way to describe how fast an enzyme works as its substrate concentration rises, summarised by two numbers, Km and Vmax, and a third, kcat, once the enzyme concentration is known. Protease assays on synthetic peptide substrates and enzyme-inhibitor screens are built on it. For a lab working with research peptides, it is also a test of reagent quality: a kinetic constant is only as good as the substrate concentration it was calculated from.
This guide covers the equation’s origins, each term in plain words, how to read the plot, why Lineweaver-Burk misleads, the assumptions that break in real assays, and why it all matters for peptide and inhibitor research.
The short answer
- The Michaelis-Menten equation is v0 = Vmax[S] / (Km + [S]): the initial rate (v0) of an enzyme reaction at substrate concentration [S].
- Vmax is the ceiling. It is the rate at substrate saturation and equals kcat × total enzyme concentration.
- Km is a concentration. It is the substrate concentration at which the rate is exactly half of Vmax. It equals (k−1 + kcat) / k1, so it is not a pure binding constant.
- kcat is the turnover number. It is the number of substrate molecules one enzyme active site converts per second at saturation, in units of s⁻¹.
- kcat/Km is catalytic efficiency. In units of M⁻¹ s⁻¹, it sets the rate at low substrate concentration and is the fairest single number for comparing two substrates of one enzyme.
- Fit the curve, not a reciprocal plot. Nonlinear regression on untransformed rates is recommended; Lineweaver-Burk distorts error.
Michaelis-Menten kinetics
Also called: Michaelis-Menten equation, saturation kinetics, steady-state enzyme kinetics
- Equation
- v0 = Vmax[S] / (Km + [S])
- Mechanism
- E + S ⇌ ES → E + P (one substrate, product release irreversible)
- Km
- [S] at half of Vmax; (k−1 + kcat) / k1; units of concentration
- Vmax
- kcat × total enzyme; units of concentration per time
- kcat
- Turnover number; s⁻¹
- kcat/Km
- Specificity constant (catalytic efficiency); M⁻¹ s⁻¹
- Origins
- Michaelis and Menten, 1913; steady-state form by Briggs and Haldane, 1925
- Recommended fit
- Nonlinear regression of initial rates
Where the evidence stands
- Derived and tested
- Standard for single-substrate initial rates
- Exact for every enzyme
- Comparable between labs without stated conditions
The model is a century old and well validated, but Km and kcat only mean something alongside the pH, temperature, buffer and enzyme preparation they were measured with.
Where the Michaelis-Menten equation came from
In 1913, Leonor Michaelis and Maud Menten published a study of invertase, the enzyme that splits sucrose, in the German journal Biochemische Zeitschrift [1]. Their key move was to measure rates under controlled conditions, before substrate use and product build-up blurred the picture.
Menten was Canadian. She was born in Port Lambton, Ontario, earned a master’s degree (1907) and an MD (1911) at the University of Toronto, and went to Berlin in 1912 to work with Michaelis. She was inducted into the Canadian Medical Hall of Fame in 1998 [4].
In 2011, Kenneth Johnson and Roger Goody published an English translation and re-analysed the original data [2]. The 1913 work proved more rigorous than its reputation: Michaelis and Menten fitted complete reaction time courses with an integrated rate equation that allowed for product inhibition, and the constant they used to describe all of their data was effectively Vmax/Km, which equals kcat/Km multiplied by the enzyme concentration, rather than Km alone.
The 1913 derivation assumed that enzyme and substrate reach a rapid equilibrium with their complex. In 1925, George Briggs and J. B. S. Haldane replaced that with a weaker and more general assumption: that the concentration of the enzyme-substrate complex stays roughly constant while the rate is measured, the steady state [3]. The equation keeps its shape, and the steady-state form is the one taught today [10].
The Michaelis-Menten equation, term by term
Free enzyme (E) binds substrate (S) with rate constant k1; the complex (ES) either falls apart (k−1) or forms product (kcat, sometimes written k2):
E + S ⇌ ES → E + P
Setting the rate of change of [ES] to zero (the steady state) with total enzyme fixed gives v0 = Vmax[S] / (Km + [S]):
| Term | Plain-words meaning | Typical units |
|---|---|---|
| v0 | Initial rate: product formed per unit time before substrate is noticeably used up | µM/s or µM/min |
| [S] | Free substrate concentration, usually taken as the amount added | µM or mM |
| Vmax | Rate when every active site is occupied; equals kcat × [E]total | µM/s |
| Km | [S] giving half of Vmax; (k−1 + kcat) / k1 | µM or mM |
| kcat | Turnovers per active site per second at saturation | s⁻¹ |
| kcat/Km | Effective second-order rate constant for free enzyme meeting free substrate | M⁻¹ s⁻¹ |
Two consequences follow. Vmax depends on how much enzyme is in the well; dividing by the active enzyme concentration gives kcat, the enzyme’s own property. And Km matches the dissociation constant of the ES complex only in the special case where the complex falls apart much faster than it reacts (kcat much smaller than k−1). Reading a low Km as “tight binding” is therefore a rough rule, not a definition [10].
Michaelis Menten plot: how to read the curve
Plotting initial rate against substrate concentration gives a rectangular hyperbola. It has three regions worth recognising, and the numbers come straight from the equation:
- Low [S], well below Km. The curve is close to a straight line through the origin. Here v0 ≈ (kcat/Km)[E][S], so the initial slope reports catalytic efficiency.
- [S] equal to Km. The rate is exactly half of Vmax. At a quarter of Km it is 20% of Vmax; at four times Km it is 80%.
- High [S], well above Km. The curve flattens. At nine times Km the rate has reached 90% of Vmax, and it only approaches Vmax asymptotically, which is why Vmax cannot be read off the last data point.
A practical consequence: to pin down both parameters, the substrate series has to straddle Km. The NIH Assay Guidance Manual recommends measuring initial rates across roughly 0.2 to 5 times Km, using eight or more concentrations on later passes, with points both above and below Km [9].
kcat, Km and the catalytic efficiency formula
The turnover number is calculated as kcat = Vmax / [E]total, where [E]total is the concentration of active sites. A kcat of 10 s⁻¹ means each active site converts ten substrate molecules per second when it never has to wait for substrate.
The catalytic efficiency formula is simply kcat divided by Km. Its units are M⁻¹ s⁻¹ because it behaves like a second-order rate constant: at low substrate, the rate is (kcat/Km) × [E] × [S]. Two properties make it the number enzymologists compare:
- It ranks competing substrates. When two substrates are present together, the enzyme converts them in the ratio of their kcat/Km values multiplied by their concentrations. A substrate with a lower Km but a much lower kcat can lose that competition.
- It has a physical ceiling. kcat/Km cannot exceed the rate at which enzyme and substrate diffuse together. A survey of several thousand literature values by Bar-Even and colleagues found that the average enzyme sits at about 10⁵ M⁻¹ s⁻¹, far below that diffusion limit and below the impression many textbooks give [11].
Km and kcat are conditional. Both move with pH, temperature, buffer and the exact substrate. The STRENDA guidelines exist because enzyme data are often published without enough detail to repeat them [13].
Why Lineweaver-Burk plots distort error
Before computers, the hyperbola was turned into a straight line. Lineweaver and Burk’s 1934 double-reciprocal plot graphs 1/v0 against 1/[S], with an intercept of 1/Vmax and a slope of Km/Vmax [5]. It is useful for displaying inhibition patterns but poor for estimating parameters.
The reason is arithmetic. Suppose Vmax and Km are both 1 (in any units) and every rate carries the same absolute error of ±0.01:
- At [S] = 0.1 Km, the true rate is 0.091. The measured range 0.081 to 0.101 becomes a reciprocal range of about 9.9 to 12.4, a spread of 2.5 units.
- At [S] = 10 Km, the true rate is 0.909. The range 0.899 to 0.919 becomes 1.088 to 1.112, a spread of 0.024 units.
The same experimental error is magnified about a hundred times at the low-substrate end, and those least reliable points sit furthest out on the 1/[S] axis, where they dominate the slope of an ordinary least-squares line. Statistical work on estimating these parameters goes back at least to Wilkinson’s 1961 analysis [6], and modern guidance is blunt: the reciprocal transformation distorts the experimental error, so the slope and intercept should not be used to determine Km and Vmax; fit the untransformed data by nonlinear regression instead [8, 9]. Where a graphical check is wanted, Eisenthal and Cornish-Bowden’s direct linear plot is far less sensitive to outliers [7].
The assumptions, and where they fail
The equation is exact only for a model. Each assumption below corresponds to a real way an assay can go wrong, and most can be checked with a control:
| Assumption | What breaks | How labs check it |
|---|---|---|
| Rates are initial rates | Substrate depletion, product inhibition and reverse reaction slow the reaction and lower apparent rates | Keep conversion under about 10% and confirm progress curves are linear over the read window [9] |
| Substrate far exceeds enzyme | Bound substrate is no longer negligible, so [S] added does not equal [S] free | Substrate-to-enzyme ratios above roughly 100:1 [9]; if enzyme approaches Km, use the quadratic (tight-binding) form [10] |
| The enzyme is stable | Activity lost during the assay mimics product inhibition | Run progress curves at three or four enzyme concentrations; plateaus at similar levels indicate stability [9] |
| Signal is proportional to product | Detector saturation or a non-linear standard curve bends the data | Calibrate the signal against known product and stay in the instrument’s linear range [9] |
| One substrate, no cooperativity | Two-substrate enzymes, allosteric enzymes and sigmoidal curves do not fit a hyperbola | Vary one substrate at fixed, stated levels of the other; use the appropriate model |
Why it matters for peptide and enzyme-inhibitor research
Peptides as protease substrates
Dipeptidyl peptidase IV (DPP-4, EC 3.4.14.5) releases an N-terminal dipeptide from a polypeptide, preferentially when the second residue is proline, provided the third is not proline [14]. Both GLP-1(7-36)amide (His-Ala-Glu-Gly…) and GIP (Tyr-Ala-Glu-Gly…) carry alanine in that second position, as their UniProt sequences show [16], and Mentlein and colleagues showed in 1993 that DPP-4 hydrolyses both [15]. Comparing how fast an enzyme processes a native peptide and a modified analogue is a Michaelis-Menten question, and kcat/Km summarises the difference. Our GIP explainer gives the background.
Protease kinetics are usually measured with fluorogenic peptide substrates. In a classic design, Matayoshi and colleagues flanked a protease cleavage site with a fluorophore (EDANS) and a quencher (DABCYL); cleavage separated them and fluorescence rose about 40-fold, giving a continuous rate readout [17]. The signal must be calibrated against known cleaved product before it can be converted into µM/s.
Why substrate quality changes the constants
For a synthetic peptide substrate, [S] is calculated from a weighed mass and a molecular weight. If the real concentration of intact substrate is a fraction f of the nominal value at every point, the fitted Km comes out as the true Km divided by f, while Vmax is unchanged. A substrate that is actually 80% of its nominal concentration therefore inflates the apparent Km by 25% and understates kcat/Km by 20%. Lyophilized peptides carry counter-ions and water, so content below 100% is normal; our guides to net peptide content and TFA salts and the peptide calculator show how to correct for it. Impurities matter too: truncated or deletion sequences can act as competing substrates or inhibitors.
Stability is the other trap. A peptide substrate that hydrolyses or oxidises in the buffer on its own produces signal with no enzyme present, so a no-enzyme control belongs on every plate, and a scrambled-sequence control can show whether cleavage depends on the intended recognition site. See our peptide stability guide.
Small-molecule and cofactor reagents for metabolic enzyme research, priced in CAD and shipped from inside Canada.
Browse metabolic research reagentsEnzyme inhibitors and two-substrate enzymes
Inhibitor research compounds are characterised kinetically as well. 5-Amino-1MQ (5-amino-1-methylquinolinium) belongs to the methylquinolinium series of nicotinamide N-methyltransferase (NNMT) inhibitors described by Stanley Watowich’s group, which were reported to be selective against related S-adenosylmethionine (SAM)-dependent methyltransferases [18, 19]. NNMT has two substrates, nicotinamide and the methyl donor SAM, so its kinetics are measured by varying one substrate while holding the other at a stated concentration; the Km obtained is an apparent value for those conditions. Our 5-Amino-1MQ research guide covers the studies, and the NAD+ explainer the nicotinamide side.
Glutathione S-transferases are another two-substrate case, using reduced glutathione plus an electrophile [20]; see GSH vs GSSG. Inhibitors shift the curve in characteristic ways: a competitive inhibitor raises the apparent Km and leaves Vmax unchanged, while a non-competitive inhibitor lowers Vmax. That is why the Assay Guidance Manual advises running inhibitor screens at substrate concentrations at or below Km, where competitive inhibitors are easiest to detect [9].
What’s established and what isn’t
Reasonably well established
- The hyperbolic rate law describes single-substrate enzymes under steady-state, initial-rate conditions.
- Km is the substrate concentration at half of Vmax, and kcat/Km governs the rate at low substrate.
- Nonlinear regression gives better estimates than reciprocal plots, which distort error.
- DPP-4 cleaves N-terminal dipeptides and hydrolyses GLP-1(7-36)amide and GIP.
Open questions
- How well test-tube constants describe enzymes in crowded cells, where diffusion and local concentrations differ.
- How comparable published Km values are when assay conditions are incompletely reported.
- For multi-substrate enzymes such as NNMT, which binding order and mechanism apply under a given set of conditions.
Sourcing reagents for kinetic work in Canada
A kinetic constant inherits every error in the concentrations behind it. Before a reagent goes into a Km series, ask any Canadian peptide supplier for:
- Identity by mass spectrometry, so the molecule in the well is the one in the equation.
- Purity by HPLC with the method stated. Our HPLC testing guide and method validation explainer cover what to look for.
- Salt form and counter-ion, which change the active content of a weighed mass.
- A batch number that matches the report, explained in our COA guide.
- Storage guidance, since a degraded substrate changes [S] before the assay starts. See the peptide storage guide.
For shipping and documentation when buying research peptides in Canada, see our Canadian research peptides guide.
 5-Amino-1MQMethylquinolinium NNMT inhibitor used in enzyme-inhibition researchView product
 Glutathione (GSH)Tripeptide co-substrate of glutathione S-transferasesView product
 NAD+Coenzyme used in dehydrogenase-coupled enzyme assaysView product
Research use only. Pure Peptides Canada products are laboratory reagents for in-vitro research, not for human or veterinary use. This article explains published research for education; it is not medical, dietary or dosing guidance.
Frequently asked questions
What is the Michaelis-Menten equation?
The Michaelis-Menten equation is v0 = Vmax[S] / (Km + [S]). It describes how the initial rate of an enzyme reaction rises with substrate concentration and levels off at a maximum, Vmax. Leonor Michaelis and Maud Menten published it in 1913.
What do Km and Vmax mean?
Vmax is the reaction rate when the enzyme is fully saturated with substrate, and it equals kcat multiplied by the total enzyme concentration. Km is the substrate concentration at which the rate reaches half of Vmax. Km is not a direct measure of affinity.
What is the difference between kcat and kcat/Km?
kcat, the turnover number, is how many substrate molecules one active site converts per second when saturated, in s⁻¹. kcat/Km, the specificity constant, combines binding and chemistry and governs the rate at low substrate concentration, in M⁻¹ s⁻¹.
Why shouldn’t I use a Lineweaver-Burk plot to find Km and Vmax?
Taking reciprocals magnifies the error in the slowest rates, which are measured at the lowest substrate concentrations, and those points then dominate a straight-line fit. Fitting the untransformed initial rates to the hyperbola by nonlinear regression gives more reliable estimates.
What substrate concentrations should a Km experiment use?
The NIH Assay Guidance Manual recommends initial rates measured across roughly 0.2 to 5 times Km, with eight or more concentrations above and below Km on later passes. Each rate should be measured while less than about 10% of the substrate has been converted.
Reagents for enzyme kinetics research
Pure Peptides Canada is a Canadian-owned supplier of laboratory research reagents, based in Toronto. Orders are priced in CAD and ship tracked from inside Canada, and you can pay by credit or debit card, Interac e-Transfer or cryptocurrency at checkout.
References
- Michaelis L, Menten ML. Die Kinetik der Invertinwirkung. Biochem Z. 1913;49:333–369. (English translation: reference 2.)
- Johnson KA, Goody RS. The original Michaelis constant: translation of the 1913 Michaelis-Menten paper. Biochemistry. 2011;50:8264–8269. DOI
- Briggs GE, Haldane JBS. A note on the kinetics of enzyme action. Biochem J. 1925;19(2):338–339. DOI
- Canadian Medical Hall of Fame. Maud L. Menten, MD PhD, 1998 inductee. cdnmedhall.ca
- Lineweaver H, Burk D. The determination of enzyme dissociation constants. J Am Chem Soc. 1934;56:658–666. DOI
- Wilkinson GN. Statistical estimations in enzyme kinetics. Biochem J. 1961;80(2):324–332. DOI
- Eisenthal R, Cornish-Bowden A. The direct linear plot: a new graphical procedure for estimating enzyme kinetic parameters. Biochem J. 1974;139(3):715–720. DOI
- GraphPad Software. Prism curve fitting guide: Equation: Michaelis-Menten model. graphpad.com
- NIH Chemical Genomics Center and Eli Lilly and Company. Assay Guidance Manual: Enzymatic Assays (2008 edition, archived). Archived page
- Atkins WM. Michaelis-Menten kinetics and Briggs-Haldane kinetics. University of Washington, Department of Medicinal Chemistry. depts.washington.edu
- Bar-Even A, Noor E, Savir Y, Liebermeister W, Davidi D, Tawfik DS, Milo R. The moderately efficient enzyme: evolutionary and physicochemical trends shaping enzyme parameters. Biochemistry. 2011;50(21):4402–4410. DOI
- Johnson KA. A century of enzyme kinetic analysis, 1913 to 2013. FEBS Lett. 2013;587:2753–2766. DOI
- Tipton KF, Armstrong RN, Bakker BM, et al. Standards for Reporting Enzyme Data: the STRENDA Consortium: what it aims to do and why it should be helpful. Perspect Sci. 2014;1:131–137. DOI
- ENZYME nomenclature database, SIB Swiss Institute of Bioinformatics. EC 3.4.14.5, dipeptidyl-peptidase IV. enzyme.expasy.org
- Mentlein R, Gallwitz B, Schmidt WE. Dipeptidyl-peptidase IV hydrolyses gastric inhibitory polypeptide, glucagon-like peptide-1(7-36)amide, peptide histidine methionine and is responsible for their degradation in human serum. Eur J Biochem. 1993;214(3):829–835. DOI
- UniProt Consortium. UniProtKB P01275 (glucagon precursor, human) and P09681 (gastric inhibitory polypeptide precursor, human). P01275; P09681
- Matayoshi ED, et al. Novel fluorogenic substrates for assaying retroviral proteases by resonance energy transfer. Science. 1990;247(4945):954–958. DOI
- Neelakantan H, Vance V, Wetzel MD, Wang HL, McHardy SF, Finnerty CC, Hommel JD, Watowich SJ. Selective and membrane-permeable small molecule inhibitors of nicotinamide N-methyltransferase reverse high fat diet-induced obesity in mice. Biochem Pharmacol. 2018;147:141–152. DOI
- Neelakantan H, Wang HL, Vance V, Hommel JD, McHardy SF, Watowich SJ. Structure-activity relationship for small molecule inhibitors of nicotinamide N-methyltransferase. J Med Chem. 2017;60(12):5015–5028. DOI
- Habig WH, Pabst MJ, Jakoby WB. Glutathione S-transferases. J Biol Chem. 1974;249(22):7130–7139. DOI
For laboratory research use only. Not for human or veterinary use. This article summarizes published research for educational purposes and is not medical advice.