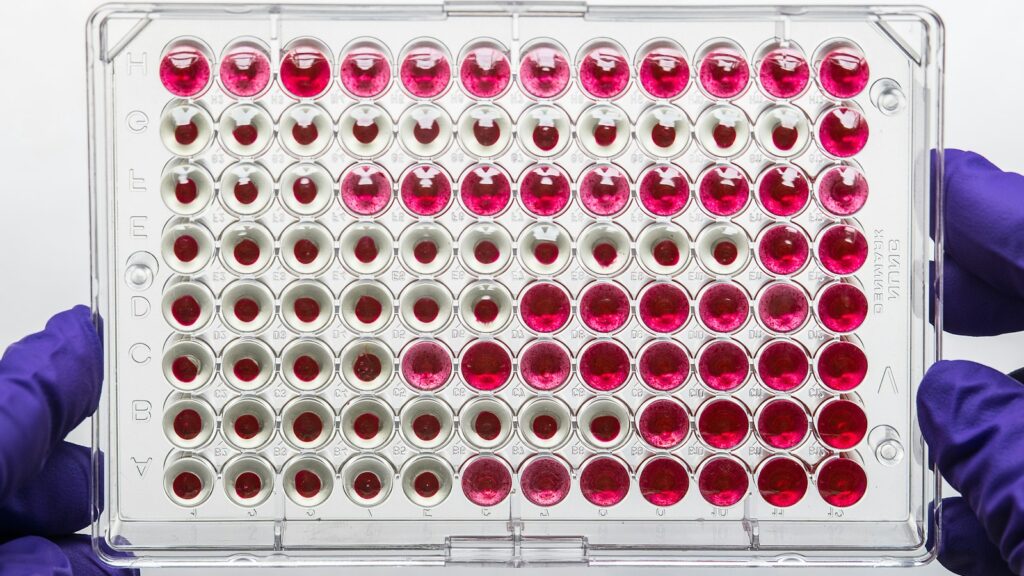
The Bradford assay and the bicinchoninic acid (BCA) assay are two of the standard colour tests laboratories use to measure protein concentration, and both were designed and calibrated with proteins in mind. Point either one at a short synthetic peptide and it can return a number that is too low, or no colour at all. That matters to anyone who checks a research peptide’s concentration or reads a study that reports one.
This guide covers how the Bradford, BCA and Lowry assays work, why the standard skews results, what interferes with each, the documented size limits, and what laboratories use instead.
The short answer
- The Bradford assay measures dye binding. Coomassie Brilliant Blue G-250 turns from reddish-brown to blue when it binds protein in acid; the colour is read at 595 nm and tracks mainly arginine, lysine and histidine.
- The BCA assay measures copper reduction. Protein reduces Cu2+ to Cu+ in alkaline solution, and two bicinchoninic acid molecules bind each Cu+ in a purple complex read at 562 nm; the peptide backbone plus cysteine, cystine, tyrosine and tryptophan drive the signal.
- Both answers are relative to a standard. Relative to bovine serum albumin (BSA), the colour of 14 proteins varied with a coefficient of variation of 38.2 per cent in Thermo Fisher’s Bradford kit and 14.7 per cent in its BCA kit.
- Short peptides can fall below both assays’ documented limits. Thermo Fisher states that a peptide or protein generally needs at least 3,000 daltons (Da) to be detected with Coomassie reagents, and that peptides under 2,000 Da cannot be quantified with the BCA assay.
- Composition decides the colour. Few basic residues means little Bradford colour, and no cysteine, tyrosine or tryptophan leaves BCA colour to the backbone alone.
- Direct methods measure the molecule. UV absorbance with an extinction coefficient calculated from the sequence, or amino acid analysis, quantifies the peptide itself; a weighed powder also contains counter-ions and water.
Bradford vs BCA at a glance
Coomassie dye-binding assay · bicinchoninic acid assay · colorimetric protein assays
- Bradford signal
- Coomassie G-250 bound to protein, read at 595 nm
- BCA signal
- Cu+–BCA complex, read at 562 nm
- Bradford responds to
- Mainly arginine, lysine and histidine
- BCA responds to
- Peptide bonds; cysteine, cystine, tyrosine, tryptophan
- Usual standard
- BSA; bovine gamma globulin for antibodies
- Documented size floor
- About 3,000 Da (Coomassie); 2,000 Da (BCA)
- For synthetic peptides
- UV absorbance from the sequence; amino acid analysis
Where the evidence stands
- Standardized method
- Validated for proteins
- Comparable between proteins
- Suitable for short peptides
Both assays are mature for proteins measured against a matched standard; neither is designed for peptides below a few thousand daltons.
How the Bradford assay works
Marion Bradford published the method in 1976 in Analytical Biochemistry. A 2014 Nature analysis of the Web of Science placed the paper third on its list of the most-cited papers, with more than 155,000 citations.
The reagent is an acidic solution of Coomassie Brilliant Blue G-250. Free dye is reddish-brown, with an absorbance maximum at 465 nm; protein-bound dye is blue, and the two forms differ most at 595 nm, where the assay is read. Thermo Fisher links the colour mainly to arginine, lysine and histidine, with van der Waals forces and hydrophobic interactions also involved, and notes that the number of dye molecules bound is roughly proportional to the protein’s positive charges; a 2008 mechanism study likewise described hydrophobic interactions combined with ionic bonding to basic amino acids. The kit takes 10 minutes at room temperature, but its colour response is non-linear as protein concentration rises; Zor and Selinger showed in 1996 that linearizing it also increases sensitivity.
How the BCA assay works, and where Lowry fits
Smith and colleagues described the BCA assay in 1985. In alkaline solution, protein reduces cupric ions (Cu2+) to cuprous ions (Cu+), the biuret reaction; two bicinchoninic acid molecules then chelate each Cu+, forming a purple, water-soluble complex that absorbs strongly at 562 nm. Thermo Fisher’s user guide attributes the colour to the protein’s macromolecular structure, its number of peptide bonds and four residues: cysteine, cystine, tryptophan and tyrosine, the colour-forming groups that Wiechelman and colleagues investigated in 1988.
The biuret step has a floor: single amino acids and dipeptides do not react, while tripeptides and longer chains do, each cupric ion binding four to six nearby peptide bonds. Thermo Fisher describes the peptide backbone as the major contributor to copper reduction and BCA detection as about 100 times more sensitive than the biuret reagent alone. The rate of colour formation also depends on temperature; the kit’s standard procedure is 30 minutes at 37 °C.
The Lowry assay
Lowry and colleagues’ 1951 copper method, published in the Journal of Biological Chemistry, topped Nature‘s list with more than 305,000 citations. Protein first reacts with alkaline cupric sulfate and tartrate; the Folin–phenol reagent, a phosphomolybdic–phosphotungstic acid, is then added and reduced to an intense blue, read at 750 nm. Tyrosine, tryptophan, cysteine, histidine and asparagine add extra colour.
| Feature | Bradford | BCA | Lowry |
|---|---|---|---|
| Colour reaction | Dye binds protein in acid | Cu2+ reduced to Cu+, chelated by BCA | Copper complex, then Folin–phenol reagent reduced |
| Read at | 595 nm | 562 nm | 750 nm |
| Signal driven by | Arginine, lysine, histidine | Backbone; cysteine, cystine, tyrosine, tryptophan | Copper complex; tyrosine, tryptophan, cysteine, histidine, asparagine |
| Main interferents | Most detergents | Reducing agents; copper-reducing or chelating substances | Detergents, potassium, chelators, reducing agents, thiols |
| Variation across 14 proteins (CV vs BSA) | 38.2% | 14.7% | Not in the sources used |
| Documented lower size limit | About 3,000 Da | 2,000 Da | Not in the sources used |
Why the protein standard changes the answer
Neither assay counts molecules. Each compares a sample’s colour with a standard curve, usually of bovine serum albumin (BSA), and reports the sample as though it were that protein. Thermo Fisher recommends BSA because it is widely available in high purity, bovine gamma globulin (BGG) for antibodies, and, for the greatest accuracy, a pure sample of the protein being measured. Its two kit guides report the colour of the same 14 proteins relative to BSA:
| Protein (same amount as BSA) | Bradford colour vs BSA | BCA colour vs BSA |
|---|---|---|
| Ovalbumin | 0.32 | 0.93 |
| IgG, rabbit | 0.37 | 1.12 |
| Insulin, bovine | 0.60 | 1.08 |
| Myoglobin, horse heart | 1.19 | 0.74 |
| All 14 proteins | Average 0.68; CV 38.2% | Average 1.02; CV 14.7% |
A BSA curve can misjudge a protein about threefold in the Bradford assay, where ovalbumin gave under a third of BSA’s colour, and the error can flip between assays: myoglobin reads high in one and low in the other. Studies that quantify peptides against BSA deserve the methods-section scrutiny described in our guide to reading a peptide study critically.
What interferes with each assay
The BCA vs Bradford choice often comes down to what else is in the sample, because the two fail on different chemistry.
- Bradford: most ionic and non-ionic detergents reduce colour and can precipitate the reagent, while most salts, solvents, buffers, reducing agents and metal chelators are tolerated.
- BCA: reducing agents such as dithiothreitol (DTT), and substances that reduce or chelate copper, interfere; most detergents are tolerated.
- Lowry: detergents, potassium ions, chelating agents, reducing agents and free thiols all interfere.
- Clean-up: standards made up in the sample’s own buffer offset low levels of interference, and dialysis or desalting removes more. Those steps work by molecular size, so they can remove a short peptide along with the interferent.
Why short peptides fall through both assays
Both colour reactions need more than a handful of residues, and Thermo Fisher, which sells both kits, documents the limits:
- Coomassie (Bradford): a peptide or protein generally “must be at least 3000 daltons to be detectable”, and free amino acids, peptides and low-molecular-weight proteins give no colour. The kit’s troubleshooting table lists a sample below 3,000 Da as a cause of low readings and suggests a BCA kit instead.
- BCA: “Peptides smaller than 2,000 Da cannot be quantitated with the BCA assay”, because colour depends on structure, peptide bonds and the four reactive residues; Thermo Fisher points to dedicated peptide assays instead.
A peptide between 2,000 and 3,000 Da sits above the BCA limit but below the Coomassie one; anything smaller sits below both. Some research peptides are far smaller, such as six-residue GHRP-2 at about 818 Da.
Above the limits, colour still depends on composition, and a short sequence cannot average out its quirks.
| Peptide | Size | Arg, Lys, His (Bradford) | Cys, Tyr, Trp (BCA) | Against the limits |
|---|---|---|---|---|
| GHRP-2 | 6 residues, about 818 Da | 1 (Lys) | 1 (Trp) | Below both |
| SNAP-8 | 8 residues, about 1,075 Da | 2 (Arg) | None | Below both |
| LL-37 | 37 residues, about 4,493 Da | 11 (5 Arg, 6 Lys) | None | Above both |
| IGF-1 LR3 | 83 residues, about 9,112 Da | 10 (7 Arg, 3 Lys) | 9 (6 Cys, 3 Tyr) | Above both |
| Bovine insulin (reference) | 51 residues, about 5,734 Da | 4 (1 Arg, 1 Lys, 2 His) | 10 (6 Cys, 4 Tyr) | Above both |
IGF-1 LR3, the 83-residue analogue in our IGF-1 LR3 research guide, sits well above both limits. LL-37 clears them too, but its BCA colour would rest on its backbone alone; we found no published response factor for it in either assay.
A weak reading usually reflects the assay, not the sample. If a Bradford or BCA assay gives little or no colour with a short peptide, the documented size limits are the first explanation to consider, not missing material. Peptide content is a question for amino acid analysis or UV absorbance.
IGF-1 LR3 and GHRP-2 sit at opposite ends of this size range. Both are research peptides in our Growth & Signaling category, priced in CAD and shipped from inside Canada.
Browse the Growth & Signaling categoryWhat labs use instead for synthetic peptides
For a synthetic peptide of known sequence, the better question is how many molecules are present, not how much colour they make.
UV absorbance with a sequence-based extinction coefficient
By the Beer–Lambert law, absorbance divided by the molar extinction coefficient and the path length gives a molar concentration. At 280 nm the coefficient can be calculated from the sequence: ExPASy’s ProtParam tool, following Pace and colleagues (1995), sums 5,500 M−1 cm−1 per tryptophan, 1,490 per tyrosine and 125 per cystine, and warns of errors above 10 per cent for proteins without tryptophan. Sequences with none of the three, such as SNAP-8 and LL-37, get a calculated value of zero.
Shorter wavelengths fill the gap, because the peptide bond itself absorbs there. Anthis and Clore described a sequence-based method at 205 nm that does not need tryptophan or tyrosine, and Kuipers and Gruppen measured the peptide bond at 923 M−1 cm−1 at 214 nm, with tryptophan about 30 times stronger. Our peptide calculator for molarity and dilution and guide to peptide molecular weight cover the arithmetic. A scrambled peptide control has the same residues as its parent sequence, so it gets the same calculated 280 nm coefficient.
Amino acid analysis and HPLC
Amino acid analysis hydrolyzes the peptide and quantifies the released amino acids, so it measures peptide rather than everything in the sample; our guide to amino acid analysis for peptide content covers its blind spots. Where a characterized standard of the same peptide exists, high-performance liquid chromatography (HPLC) can quantify against it. In a United States Pharmacopeia study of the nine-residue peptide oxytocin, with National Research Council Canada (NRC) chemists among the authors, an HPLC assay showed lower between-laboratory variability than quantitative nuclear magnetic resonance (qNMR) or amino acid analysis. Reliability depends on analytical method validation.
Why the weighed powder is not the peptide
A lyophilized peptide’s weight includes counter-ions such as trifluoroacetate (TFA) or acetate, and water. A candidate certified reference material of angiotensin II, which NRC characterized by combining qNMR and LC-MS/MS amino acid analysis, was 69.1 ± 0.9 per cent peptide by mass, with TFA at nearly a quarter; in an international comparison of synthetic human C-peptide, the reference value put the peptide at 80.2 per cent of the material. A concentration calculated from weight alone overstates the peptide, as our article on net peptide content and TFA versus acetate salts explains.
What’s established and what isn’t
Reasonably well established
- Bradford colour comes from Coomassie G-250 binding, mainly to basic residues, read at 595 nm.
- BCA colour comes from copper reduced mainly by the backbone and detected by BCA at 562 nm.
- Both report amounts relative to a standard, and Bradford varies more between proteins.
- The manufacturer documents limits of about 3,000 Da (Coomassie) and 2,000 Da (BCA).
- Weighed peptide powders include counter-ions and water.
Open questions
- How far a peptide just above the limits departs from a BSA curve; we found no published response factors for short synthetic peptides.
- How sharp the limits are; 3,000 Da is presented as a general rule, not a measured cut-off for each sequence.
- Whether D-amino acids, non-natural residues and end caps change the colour or UV response.
Checking peptide quantity when buying research peptides in Canada
Whichever supplier a Canadian lab uses, a colour assay against BSA is a poor check on how much peptide a vial holds. Our overview of research peptides in Canada and guide to choosing a peptide supplier in Canada cover the wider checklist. For quantity:
- Match the batch. The lot number on the report should match the vial; see our guide to reading a peptide COA.
- Read identity and purity separately. A measured mass that matches the sequence supports identity, as our LC-MS explainer describes; HPLC purity describes related impurities. Neither is peptide content.
- Ask how content was measured. Net peptide content from amino acid analysis or qNMR is meaningful; a Bradford or BCA figure against BSA is not.
Research peptides from both sides of the size limits
 IGF-1 LR3An 83-residue IGF-I analogue of about 9,100 Da, above both documented limitsView product
 LL-3737 residues and about 4,500 Da, with no cysteine, tyrosine or tryptophanView product
 GHRP-2A six-residue peptide of about 818 Da, below both documented limitsView product
 SNAP-8An eight-residue acetylated peptide of about 1,075 Da with no aromatic residuesView product
Research use only. Pure Peptides Canada products are laboratory reagents for in-vitro research, not for human or veterinary use. This article explains published research for education; it is not medical, dietary or dosing guidance.
Frequently asked questions
What is the difference between the Bradford and BCA assays?
The Bradford assay measures Coomassie Brilliant Blue G-250 dye bound to protein, read at 595 nm, and responds mainly to arginine, lysine and histidine. The BCA assay measures cuprous ions formed when protein reduces copper in alkaline solution, detected by bicinchoninic acid at 562 nm. Bradford is faster and tolerates reducing agents; BCA tolerates most detergents and varies less between proteins.
Which is more accurate, Bradford or BCA?
Neither is accurate in absolute terms, because both report concentration relative to a standard protein. Across 14 proteins in Thermo Fisher’s kits, the coefficient of variation of colour relative to bovine serum albumin was 38.2 per cent for Bradford and 14.7 per cent for BCA, so BCA is more consistent between proteins, not more accurate. The closest answer from either comes from a standard made of the protein being measured.
Can the Bradford assay be used for peptides?
Generally not for short ones. Thermo Fisher states that a peptide or protein generally needs a mass of at least 3,000 daltons to be detected with Coomassie reagents. Above that size, colour still depends on the number of basic residues, so a BSA curve can misjudge a peptide.
Can the BCA assay measure peptides?
Only larger ones. Thermo Fisher states that peptides smaller than 2,000 daltons cannot be quantified with the BCA assay, because colour depends on structure, the number of peptide bonds and cysteine, cystine, tyrosine and tryptophan content. For smaller peptides it points to dedicated peptide assays, such as an o-phthalaldehyde reagent that detects amino groups by fluorescence.
Why is BSA used as the standard in protein assays?
Bovine serum albumin is widely available in high purity and works as a general reference. Results are reported as though the sample were BSA, so proteins that respond differently are misjudged; in Thermo Fisher’s Bradford kit, ovalbumin gave under a third of BSA’s colour.
How is the concentration of a synthetic peptide measured accurately?
A direct approach is UV absorbance divided by a molar extinction coefficient calculated from the sequence: at 280 nm for peptides containing tryptophan or tyrosine, and at 205 or 214 nm for those without. Amino acid analysis is the other common reference method. Both measure the peptide itself rather than the weighed powder.
Explore growth and signalling research peptides
Our Growth & Signaling range includes six-residue GHRP-2 and 83-residue IGF-1 LR3, priced in CAD and shipped tracked from inside Canada. You can pay by credit or debit card, Interac e-Transfer or cryptocurrency at checkout.
References
- Bradford MM. A rapid and sensitive method for the quantitation of microgram quantities of protein utilizing the principle of protein-dye binding. Anal Biochem. 1976;72(1–2):248–254. DOI
- Smith PK, Krohn RI, Hermanson GT, et al. Measurement of protein using bicinchoninic acid. Anal Biochem. 1985;150(1):76–85. DOI
- Lowry OH, Rosebrough NJ, Farr AL, Randall RJ. Protein measurement with the Folin phenol reagent. J Biol Chem. 1951;193(1):265–275. DOI
- Wiechelman KJ, Braun RD, Fitzpatrick JD. Investigation of the bicinchoninic acid protein assay: identification of the groups responsible for color formation. Anal Biochem. 1988;175(1):231–237. DOI
- Georgiou CD, Grintzalis K, Zervoudakis G, Papapostolou I. Mechanism of Coomassie brilliant blue G-250 binding to proteins: a hydrophobic assay for nanogram quantities of proteins. Anal Bioanal Chem. 2008;391(1):391–403. DOI
- Zor T, Selinger Z. Linearization of the Bradford protein assay increases its sensitivity: theoretical and experimental studies. Anal Biochem. 1996;236(2):302–308. DOI
- Van Noorden R, Maher B, Nuzzo R. The top 100 papers. Nature. 2014;514:550–553. DOI
- Pace CN, Vajdos F, Fee L, Grimsley G, Gray T. How to measure and predict the molar absorption coefficient of a protein. Protein Sci. 1995;4(11):2411–2423. DOI
- Anthis NJ, Clore GM. Sequence-specific determination of protein and peptide concentrations by absorbance at 205 nm. Protein Sci. 2013;22(6):851–858. DOI
- Kuipers BJH, Gruppen H. Prediction of molar extinction coefficients of proteins and peptides using UV absorption of the constituent amino acids at 214 nm to enable quantitative reverse phase high-performance liquid chromatography-mass spectrometry analysis. J Agric Food Chem. 2007;55(14):5445–5451. DOI
- Melanson JE, Thibeault M-P, Stocks BB, Leek DM, McRae G, Meija J. Purity assignment for peptide certified reference materials by combining qNMR and LC-MS/MS amino acid analysis results: application to angiotensin II. Anal Bioanal Chem. 2018;410(26):6719–6731. DOI
- Li C, Bhavaraju S, Thibeault M-P, et al. Survey of peptide quantification methods and comparison of their reproducibility: a case study using oxytocin. J Pharm Biomed Anal. 2019;166:105–112. DOI
- Josephs RD, Li M, Song D, et al. Key comparison study on peptide purity—synthetic human C-peptide. Metrologia. 2017;54(1A):08007. CCQM-K115 final report. DOI
- Francis GL, Ross M, Ballard FJ, et al. Novel recombinant fusion protein analogues of insulin-like growth factor (IGF)-I indicate the relative importance of IGF-binding protein and receptor binding for enhanced biological potency. J Mol Endocrinol. 1992;8(3):213–223. DOI
- Thermo Fisher Scientific. Chemistry of protein assays. Pierce protein methods, technical web page. Web page
- Thermo Fisher Scientific. Overview of protein assay methods. Pierce protein methods, technical web page. Web page
- Thermo Fisher Scientific. Pierce BCA Protein Assay Kit user guide. Pub. No. MAN0011430, Rev. D, 18 June 2026. Table 3, protein-to-protein variation. User guide
- Thermo Fisher Scientific. Pierce Bradford Protein Assay Kit user guide. Pub. No. MAN0011181, Rev. C.0, 17 July 2023. Table 3 and troubleshooting. User guide
- Thermo Fisher Scientific. Pierce BCA Solid (cat. no. 23230): FAQs, “Can the BCA Protein Assay Kit quantitate peptides?” FAQ page
- SIB Swiss Institute of Bioinformatics. ProtParam documentation: extinction coefficient. Documentation
- UniProt Consortium. UniProtKB P05019 (insulin-like growth factor 1, human), P49913 (cathelicidin antimicrobial peptide; LL-37 is residues 134–170), P01317 (insulin, bovine) and P02769 (albumin, bovine; mature chain residues 25–607). Entry
- US Food and Drug Administration. Global Substance Registration System: pralmorelin (GHRP-2), UNII E6S6E1F19M; acetyl octapeptide-3 (SNAP-8), UNII 8K14HJF88S. Record
For laboratory research use only. Not for human or veterinary use. This article summarizes published research for educational purposes and is not medical advice.