
Every credible peptide certificate of analysis has two halves. HPLC tells you how pure the sample is. Mass spectrometry tells you what it is. The mass section is also the part most readers skim, because its numbers rarely match the molecular weight printed on the label. They aren’t supposed to, and once you know why, the spectrum becomes one of the most useful pages in the report.
This guide explains what a mass spectrometer measures, why one peptide produces several peaks, how isotope spacing reveals charge, how software turns a ladder of peaks into one mass, which extra peaks are harmless and which are warnings, and what mass spectrometry can’t tell you.
The short answer
- A mass spectrometer measures mass-to-charge ratio (m/z), not mass. A peptide carrying two extra protons appears at roughly half its mass plus one.
- Electrospray ionization (ESI), the most common method for peptides, produces several charge states of the same molecule. MALDI mostly produces singly charged ions.
- Isotope spacing reveals the charge: peaks 1 apart mean 1+, 0.5 apart mean 2+, and about 0.33 apart mean 3+.
- For larger peptides, software deconvolutes the ladder of charge states into a single neutral mass, which should match the theoretical mass within the instrument’s accuracy.
- Mass spectrometry confirms identity, not purity or quantity, and it can’t see same-mass isomers. A good COA pairs it with HPLC.
Mass spectrometry, in six terms
The vocabulary you need to read the identity section of a COA.
- m/z
- Mass divided by charge: what the instrument actually measures
- [M+H]⁺
- The molecule plus one proton (about 1.007), carrying a charge of 1+
- Monoisotopic mass
- Mass calculated from the most common isotope of each element
- Average mass
- Mass weighted by natural isotope abundance; what labels usually print
- Deconvolution
- Converting a series of charge states into one neutral mass
- Adduct
- The molecule plus another ion, such as sodium or potassium
What a mass spectrometer measures
A mass spectrometer has three jobs: turn molecules into ions, separate the ions by mass-to-charge ratio, and count them. Peptides are fragile, so they need “soft” ionization methods that give them a charge without breaking them apart. Two dominate. Electrospray ionization (ESI) sprays the peptide solution through a charged needle; matrix-assisted laser desorption/ionization (MALDI) uses a laser to lift peptides out of a crystalline matrix. John Fenn and Koichi Tanaka, who developed soft ionization for large biomolecules, shared the 2002 Nobel Prize in Chemistry.
Peptide COAs most often come from LC-MS: liquid chromatography separates the sample and feeds it straight into an electrospray mass spectrometer, so one run delivers both a chromatogram and a spectrum.
Why one peptide shows several peaks
Electrospray adds protons to basic sites on the peptide, such as the N-terminus, lysine and arginine. Each proton adds about 1.007 to the mass and one unit of charge, so the instrument reports (M + n × 1.007) ÷ n. The same molecule therefore appears at several positions, one for each charge state it picks up.
| Peptide | Theoretical mass | Typical ESI ions (m/z) |
|---|---|---|
| KPV | 342.23 (monoisotopic) | [M+H]⁺ 343.2 |
| Epitalon (AEDG) | 390.14 | [M+H]⁺ 391.1 |
| TB-500 fragment (Ac-LKKTETQ) | 888.49 | [M+H]⁺ 889.5; [M+2H]²⁺ 445.3 |
| BPC-157 | 1,418.70 | [M+H]⁺ 1,419.7; [M+2H]²⁺ 710.4; [M+3H]³⁺ 473.9 |
| Retatrutide | About 4,731 (average) | [M+4H]⁴⁺ about 1,184; [M+5H]⁵⁺ about 947; [M+6H]⁶⁺ about 790 |
So a COA that lists m/z 710.4 for BPC-157 is reporting its doubly charged ion, which is exactly what you’d expect. The number to check is the mass it implies, not whether it matches the label at first glance.
Isotope peaks: the spacing tells you the charge
About 1.1% of natural carbon is carbon-13, so a peptide with dozens of carbon atoms appears as a small cluster of peaks: the monoisotopic peak, then versions carrying one, two or more heavier atoms. Each extra neutron adds about one unit of mass. Divided by the charge, that spacing becomes 1 for a 1+ ion, 0.5 for a 2+ ion and about 0.33 for a 3+ ion, so on a high-resolution instrument, the gap between isotope peaks tells you the charge directly.
Two practical consequences follow. Monoisotopic and average masses differ, by about 0.8 for BPC-157 and by several units for a 4 to 5 kDa peptide, so a COA should say which one it reports. And for larger peptides the tallest isotope peak is no longer the monoisotopic one, so reading the tallest peak can produce an apparent error of a unit or two that isn’t really an error.
Deconvolution for larger peptides
Larger peptides such as retatrutide, semaglutide or full-length thymosin beta-4 pick up many protons, producing a ladder of peaks. Deconvolution software works backwards from adjacent charge states to a single neutral mass. For retatrutide, peaks near m/z 1,184, 947 and 790 should all point to the same neutral mass of about 4,731.
A strong COA shows the raw spectrum with the charge states labelled, plus the deconvoluted result. A single number with no spectrum and no method is much harder to trust. For lipidated peptides, see our guide to peptide half-life engineering for why their masses are so large. If a supplier’s report gives only a single number, ask for the spectrum; our checklist sets out what to ask a Canadian peptide supplier.
Every batch is tested for identity by mass spectrometry and purity by HPLC.
See our lab testingExtra peaks: harmless or a warning?
| Signal | Offset from [M+H]⁺ | Usually means |
|---|---|---|
| Sodium adduct [M+Na]⁺ | Plus about 22 | Salt in the sample or system; common and usually harmless |
| Potassium adduct [M+K]⁺ | Plus about 38 | Same; common |
| Oxidation | Plus 16 | Oxidized methionine, cysteine or tryptophan |
| Deamidation | Plus about 1 | Asparagine or glutamine converted to an acid; easy to mistake for an isotope peak |
| Dimer [2M+H]⁺ | About twice the mass | Often formed in the ion source rather than present in the vial |
| Deletion or truncation | Minus one or more residues | Synthesis impurity |
| Leftover protecting group | Plus 56 (tBu), 242 (Trt) or 252 (Pbf) | Incomplete deprotection after synthesis |
Offsets are for singly charged ions; divide by the charge for multiply charged ones. A doubly charged sodium adduct of BPC-157, for example, sits about 11 above the main 2+ peak. Our guide to how research peptides are made explains where synthesis impurities come from, and how peptides degrade covers oxidation and deamidation.
What mass spectrometry can’t tell you
- Purity or quantity. Different molecules ionize with different efficiency, so peak heights don’t equal amounts. That is HPLC’s job; see our HPLC testing guide.
- Same-mass isomers. β-aspartyl forms, D-amino-acid substitutions and scrambled sequences weigh exactly the same as the target.
- Sequence order on its own. Confirming the order of amino acids needs tandem mass spectrometry (MS/MS), which fragments the peptide and reads the pieces.
- Counter-ions and water. These affect how much of the powder is peptide; see net peptide content.
- Endotoxin. Bacterial endotoxin doesn’t appear in a peptide spectrum; see endotoxin in research peptides.
Checklist: the mass section of a COA
- The theoretical mass, and whether it is monoisotopic or average.
- The observed m/z values with their charge states, ideally with the spectrum shown.
- For larger peptides, a deconvoluted mass.
- A stated tolerance or mass error; high-resolution instruments are typically accurate to a few parts per million.
- An explanation for any large unexpected peaks.
- The method (LC-MS with ESI, or MALDI) and the laboratory that ran it.
- A lot number that matches your vial. Our COA guide covers the rest of the report.
 BPC-157Look for m/z 710.4 and 1,419.7View product and COA
 EpitalonA small peptide: mainly 1+ at 391.1View product and COA
 KPVTripeptide at m/z 343.2View product and COA
 RetatrutideNeeds a deconvoluted massView product and COA
Research use only. Peptides from Pure Peptides Canada are laboratory reagents for in-vitro research. They are not approved drugs or supplements, they are not for human or veterinary use, and nothing in this article is dosing or medical guidance.
Frequently asked questions
What does a mass spectrometer measure?
It measures the mass-to-charge ratio (m/z) of ions, not mass directly. A peptide that has picked up two protons appears at roughly half its mass plus one, so the numbers on a spectrum often differ from the molecular weight on a label.
Why does my peptide’s COA show a mass that differs from its molecular weight?
Usually because the spectrum shows a multiply charged ion. BPC-157, with a mass of about 1,419, commonly appears near m/z 710 as a doubly charged ion. The label may also give the average mass while the spectrum shows the monoisotopic mass.
What is deconvolution in mass spectrometry?
Deconvolution is the software step that converts a series of peaks from the same molecule at different charge states into a single neutral mass. It is standard for peptides larger than a few thousand daltons.
What is an adduct peak?
An adduct is the molecule plus another ion, most often sodium (about 22 units heavier than the protonated peak) or potassium (about 38 heavier). Small adduct peaks are common and usually come from salts rather than a problem with the peptide.
Can mass spectrometry measure peptide purity?
Not reliably. Different molecules ionize with different efficiency, so peak heights don’t reflect amounts. Purity is measured by HPLC; mass spectrometry confirms identity.
What is the difference between ESI and MALDI?
Both are soft ionization methods for peptides. Electrospray ionization (ESI) sprays a solution and usually produces several charge states, while MALDI uses a laser and a matrix and mostly produces singly charged ions.
Identity and purity on every batch
Independent mass spectrometry and HPLC for each lot, with the report matched to the vial you receive and tracked delivery across Canada.
References
- Fenn JB, Mann M, Meng CK, Wong SF, Whitehouse CM. Electrospray ionization for mass spectrometry of large biomolecules. Science. 1989;246(4926):64–71.
- Karas M, Hillenkamp F. Laser desorption ionization of proteins with molecular masses exceeding 10,000 daltons. Anal Chem. 1988;60(20):2299–2301.
- Tanaka K, Waki H, Ido Y, et al. Protein and polymer analyses up to m/z 100 000 by laser ionization time-of-flight mass spectrometry. Rapid Commun Mass Spectrom. 1988;2(8):151–153.
- The Nobel Prize in Chemistry 2002. NobelPrize.org
- Steen H, Mann M. The ABC’s (and XYZ’s) of peptide sequencing. Nat Rev Mol Cell Biol. 2004;5(9):699–711.
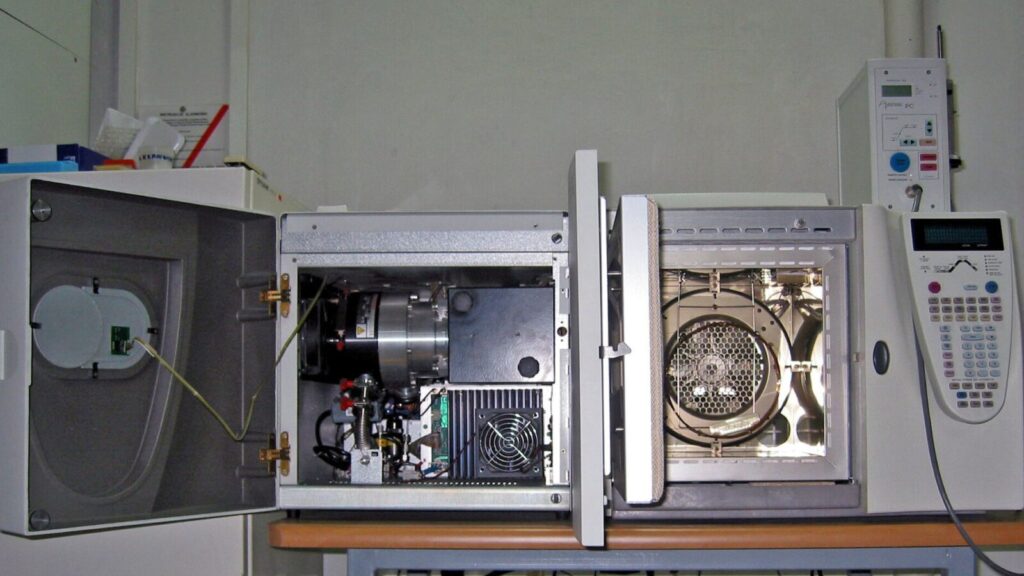
Featured image: gas chromatograph–mass spectrometer by Polimerek, licensed CC BY-SA 4.0, via Wikimedia Commons.
For laboratory research use only. Not for human or veterinary use. This article explains laboratory science for educational purposes and is not medical advice.