
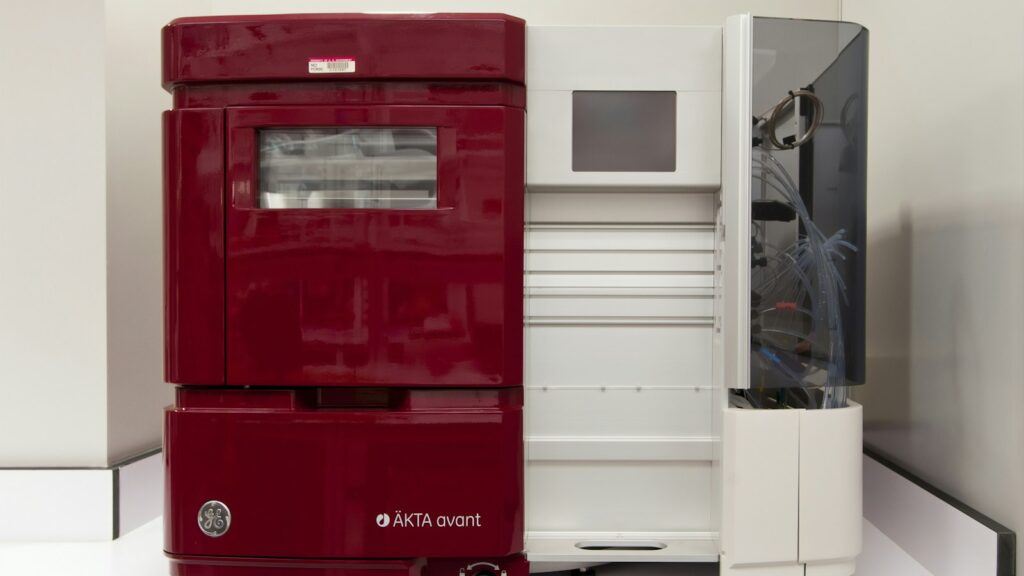
Two numbers usually sit at the top of a research-peptide certificate: a purity percentage and a mass. The purity figure comes from a chromatogram. The mass comes from a mass spectrometer. Often both come from a single run in which the chromatograph feeds the mass spectrometer, and the technique that does that is called LC-MS.
LC-MS is worth understanding properly, because its result is easy to over-read. A matching mass is strong evidence. It is not proof of sequence, it is not a purity measurement, and it says nothing at all about how much peptide is in the vial. This guide explains what the technique does, how it does it, and exactly where its authority stops.
The short answer
- LC-MS is one technique, not two bolted together. IUPAC defines a hyphenated mass-spectrometry technique as one in which mass spectrometry is interfaced with a pretreatment step — most often a chromatographic separation. The column feeds the mass spectrometer.
- Electrospray ionization makes the measurement possible. It produces intact, multiply charged ions of large fragile molecules, which is why a peptide of several thousand daltons shows up in a modest m/z window.
- Its advantage over HPLC with UV detection alone is identity. A UV trace at 214 nm gives relative peak areas; it cannot report the mass of what eluted, cannot see species with no chromophore, and cannot resolve impurities whose absorbance overlaps the main peak.
- Tandem MS (LC-MS/MS) addresses sequence, by fragmenting a selected ion and reading the ladder of fragment masses. Even then, confirmation is only ever to the limit of residue mass.
- Mass accuracy and resolving power are different quantities. One published peptide-QC method accepted identities within 5 ppm and observed a worst case of 2.4 ppm; a resolution figure is not an accuracy specification.
- Three things LC-MS does not measure: water content, counter-ion content, and therefore net peptide content. A published mass-balance study of synthetic glucagon needed Karl Fischer titration, ion chromatography and ICP-MS alongside LC-MS to settle the question.
- Leucine and isoleucine have identical residue masses. No mass measurement at any resolution separates them. That one fact is the clearest limit on what “mass confirmed” can mean.
LC-MS
Liquid chromatography–mass spectrometry · LC/MS · HPLC-MS · UHPLC-HRMS
- What it is
- A hyphenated analytical technique: a liquid-chromatographic separation whose eluent flows into a mass spectrometer
- What it reports
- A retention time and a mass-to-charge ratio for each eluting species — so separation and identity in one run
- Ion source
- Usually electrospray ionization (ESI), in positive mode for peptides
- Typical peptide method
- Reverse-phase C18 column, water/acetonitrile gradient with an acidic additive, UV at 214 nm plus a high-resolution mass analyser
- Tandem form
- LC-MS/MS: a precursor ion is isolated, fragmented, and its product ions measured — the basis of sequencing
- Key limitation
- Signal intensity is not amount; identity is confirmed only to the limit of residue mass
- Does not measure
- Water, counter-ions, inorganic residues, or net peptide content
What an LC-MS result can support
- That a species of the expected mass eluted
- That co-eluting impurities were or were not detected
- With MS/MS, a sequence consistent with the fragment ladder
- How much peptide is in the vial
The first three are what LC-MS is for. The fourth needs separate, orthogonal measurements.
What LC-MS is
The usual description — “two techniques joined together” — is looser than the formal one. IUPAC’s definition of a hyphenated mass-spectrometry technique is an analytical technique in which mass spectrometry is interfaced with a pretreatment step, most often a chromatographic separation, though other combinations are possible. The emphasis matters: it is one measurement with two axes, not two measurements stapled together.
In practice the arrangement is simple. A sample is injected onto a reverse-phase column. Components separate by how strongly they partition into the stationary phase, so each leaves the column at its own retention time. The eluent then enters the mass spectrometer’s ion source, and each eluting species is measured for mass-to-charge ratio as it arrives. A published peptide quality-control method shows the configuration in full: a C18 column, a water/acetonitrile gradient, a UV detector at 214 nm for quantitation, and a high-resolution Orbitrap mass spectrometer in positive-ion electrospray mode receiving the same eluent at the same time.
So the output is two-dimensional. The chromatographic axis tells you when something came off the column, which is where our guide to reading an HPLC chromatogram picks up. The mass axis tells you what it was, which is the subject of reading a peptide mass spectrum. LC-MS is the pairing.
How a peptide becomes an ion
A mass spectrometer can only weigh ions, and peptides arrive dissolved in liquid. Bridging that gap was the hard problem, and solving it won a share of the 2002 Nobel Prize in Chemistry.
The prize was awarded “for the development of methods for identification and structure analyses of biological macromolecules”. One half went jointly to John B. Fenn and Koichi Tanaka “for their development of soft desorption ionisation methods for mass spectrometric analyses of biological macromolecules”; the other half went to Kurt Wüthrich for nuclear magnetic resonance work. The citation does not contain the words “electrospray ionization”, and Fenn’s share was a quarter, not a third — two details that circulate wrongly. Nor did Fenn originate the idea: Dole and colleagues had reported molecular beams of macroions in 1968, and Fenn’s own landmark 1989 paper opens by saying electrospray ionization “has recently emerged” as a powerful technique.
What that 1989 paper established is the property the whole method rests on. Electrospray produces intact, multiply charged ions of large, fragile, polar biomolecules — oligonucleotides and proteins up to roughly 130,000 in molecular weight, with no upper limit found.
Multiple charging has a convenient consequence. IUPAC defines m/z as a dimensionless quantity formed by dividing the mass number of an ion by its charge number, so a highly charged ion appears at a low m/z. Take a peptide of 5,000 Da carrying five protons: using the CODATA proton mass of 1.00728 u, the arithmetic gives (5,000 + 5 × 1.00728) / 5 = 1,001. A molecule far outside a modest instrument’s mass range lands comfortably inside its m/z range. That is arithmetic, not a published finding, but it is why peptide spectra look the way they do — one molecule, several peaks, each a different charge state.
What LC-MS adds to an HPLC result
Most research-peptide certificates report purity from a chromatogram with ultraviolet detection, conventionally at 214 nm. That is a legitimate and useful number. It is also a narrower number than it looks.
The clearest published statement of why comes from a mass-balance study of synthetic glucagon, whose authors found LC-UV purity inaccurate because “some impurities do not absorb ultraviolet radiation, while others may have absorption features that overlap” the main peak — and because sequence-similar impurity peptides co-eluted with the target. Those are two separate failure modes, and a mass axis addresses both.
| Question | HPLC with UV alone | LC-MS |
|---|---|---|
| When did it elute? | Yes — retention time | Yes |
| What proportion of the absorbance is it? | Yes — peak area percentage at one wavelength | Not reliably; see the limits section |
| What is its mass? | No | Yes |
| Is an impurity hiding under the main peak? | Not if its absorbance overlaps | Often yes — a different mass separates it |
| Is there a species with no chromophore? | No | Yes, if it ionises |
| Can a poorly shaped peak still be identified? | Hard to quantify, hard to assign | Yes — in one published pool, two peptides with an N-terminal cysteine were identified by MS although they could not be quantified by UV |
Note what the table does not say. UV detection does not fail to detect impurities; it detects them and cannot identify them, and it misses the subset that does not absorb. Both statements are worth keeping straight, because the overstated version (“UV purity is meaningless”) is as wrong as the complacent one.
There is a second comparison worth making, against mass spectrometry with no separation at all. Direct infusion presents everything in the sample to the ion source simultaneously, and ions compete. A review of matrix effects in LC-MS puts the remedy plainly: appropriate chromatographic conditions improve the separation of the analyte from interfering substances, avoiding co-elution with matrix. Separation is not decoration on the front of a mass spectrometer; it is the mechanism by which the mass measurement stays trustworthy.
LC-MS/MS and what “sequence confirmed” means
A single mass constrains elemental composition. It does not establish the order of residues. Tandem mass spectrometry goes after that: one ion is isolated, deliberately broken apart, and the masses of the pieces are measured. Because the peptide backbone breaks at predictable points, the fragment masses form a ladder, and the difference between consecutive rungs is a residue mass.
The naming scheme for those fragments dates to a 1984 letter to the editors of Biomedical Mass Spectrometry by Roepstorff and Fohlman, proposing a common nomenclature for sequence ions — the a/b/c and x/y/z series still used today. The convention in current use follows Biemann’s 1990 appendix in Methods in Enzymology. Collision-induced dissociation, the classical way of breaking the ion, has its own IUPAC definition: an ion/neutral process in which the projectile ion dissociates as part of its translational energy is converted to internal energy during the collision. A later variant, higher-energy C-trap dissociation, was introduced in 2007 in a paper that states the premise directly — peptide sequencing is the basis of mass-spectrometry-driven proteomics — and uses y-ion series for de novo sequencing.
This is genuinely strong evidence, and it is also bounded. A complete fragment ladder reports residue masses in order, so anything that leaves residue mass unchanged is invisible to it. Leucine and isoleucine both have a monoisotopic residue mass of 113.084064 — identical, at any resolution, forever. A D-amino-acid substitution does not change elemental composition, so by IUPAC’s own definition of monoisotopic mass it cannot change the measured value. Aspartate isomerising to isoaspartate does not change mass either; a 2025 study of isoaspartate-containing galanin needed liquid chromatography with trapped ion mobility, electron transfer dissociation, enzyme assays and a synthetic reference standard to tell the two apart.
So the defensible claim is that LC-MS/MS confirms a sequence to the limit of residue mass. For a synthetic peptide from a known route, that is usually what anyone needs. It is not the same as “sequence proven”.
Resolution, accuracy and which mass is quoted
Two numbers get conflated constantly, so it is worth separating them. Resolving power is defined by peak overlap: for two peaks of equal height at masses m1 and m2, with overlap at a stated percentage of peak height, the resolving power is m1/(m1 − m2), and the percentage must always be stated. Mass accuracy is a different thing: the degree of conformity between the measured m/z and the theoretical m/z calculated from a proposed formula. High resolving power without calibration does not deliver accurate mass, and a resolution figure quoted as an accuracy specification is simply the wrong unit.
A 2023 review of ultra-high-resolution mass spectrometry sets out the resolving-power tiers: low resolution below about 10,000, as with a quadrupole or linear ion trap; high resolution above 10,000, as with time-of-flight analysers, which it cites at around 100,000; and ultra-high resolution above 100,000, with Orbitrap instruments commonly run at 60,000 to 70,000 or 120,000 and Fourier-transform ion cyclotron resonance reaching above a million. Those are resolution figures. For accuracy, the most useful published number for this audience is an acceptance criterion rather than an instrument claim: one peptide-pool QC method confirmed identities on an Orbitrap with a maximum tolerance of 5 ppm and observed a worst-case deviation of 2.4 ppm across the pool.
Which mass should a certificate quote? Both definitions are IUPAC’s and both are short. Monoisotopic mass is the exact mass calculated using the mass of the most abundant isotope of each element. Average mass is the mass weighted for isotopic composition. For molecules in the peptide size range, the monoisotopic value is the one that can be matched at single-ppm accuracy on a high-resolution instrument, which is what the method above did. There is no universal convention that certificates must report one or the other, so the practical advice is to check which basis a given document is using rather than assume. One caveat worth knowing: as mass rises, the monoisotopic peak weakens relative to its isotope peaks, because the proportion of heavy isotopes in the molecule grows — the ratio of the monoisotopic peak to its first isotope peak differs by a factor of about 3.5 between the 200–250 Da and 800–850 Da windows, driven mostly by carbon-13.
What LC-MS cannot tell you
This is the part a buyer actually needs, because each of these limits corresponds to a line on a certificate that people read as meaning more than it does.
| Limit | Why it exists | What it means in practice |
|---|---|---|
| Signal is not amount | Ionisation efficiency differs per peptide and per matrix. In one study of synthetic phosphopeptides spiked into cell lysate, the response ratio at a given concentration varied by two to three orders of magnitude between peptides | A percentage read off an MS trace is not a purity figure. Absolute quantitation needs a calibration curve per analyte, usually with a stable-isotope-labelled internal standard |
| Ion suppression | Co-eluting species compete for charge in the source. Suppression in electrospray has been studied mechanistically since at least 2000 | Good chromatography is part of the measurement, not a convenience. Internal standards added before extraction correct random error, and matrix-matched calibration cannot fully compensate |
| Isobars and isomers | Leucine and isoleucine are exactly isobaric. Lysine and glutamine differ by only 0.036385 Da. Deamidation adds 0.984016 Da — which sits just 0.019339 Da from a carbon-13 isotope spacing of 1.003355 Da | At nominal mass, deamidation is invisible; at modest accuracy it can be mistaken for an isotope peak. Resolving these needs accurate mass, and some cases need ion mobility or a reference standard |
| No water, counter-ion or content figure | LC-MS measures ionisable species leaving a column. It does not weigh the vial | See below — this is the gap with the largest practical consequence |
The last point deserves its own example, because a published one exists. A 2020 mass-balance study of synthetic glucagon measured every non-peptide component separately: water by coulometric Karl Fischer titration, trifluoroacetate counter-ion by ion chromatography, inorganic ions by ICP-MS, and peptide-related impurities by LC-MS against synthesised impurity standards. The manufacturer’s stated figure was 983.72 mg/g and LC-UV suggested above 98 per cent, or more than 970 mg/g. The mass-balance result was 896.36 ± 0.68 mg/g — roughly nine percentage points lower than the stated value, once everything that is not peptide had been accounted for.
That gap is not a scandal; it is the expected consequence of how synthetic peptides are isolated. Cationic peptides purified by trifluoroacetic-acid-based routes come out as trifluoroacetate salts, and a 2020 review of counter-ions in peptides notes that counter-ion content is often overlooked in quality control and is undesirable for preclinical work. Our guide to net peptide content and TFA versus acetate salts works through the arithmetic, and how research peptides are made explains where the salt comes from.
One further nuance, because it runs the other way. It is often claimed that TFA cannot be used with mass spectrometry. TFA suppression in positive-ion electrospray is real and documented from at least 1995, which is why mitigation strategies exist and why formic acid is often substituted. But the published peptide-QC method cited throughout this guide ran 0.05 per cent TFA in water and 0.04 per cent TFA in acetonitrile straight into an Orbitrap and confirmed every identity within 5 ppm. TFA costs sensitivity. It does not disqualify the measurement.
What’s settled and what isn’t
Well established
- LC-MS is a hyphenated technique in IUPAC’s sense: a separation interfaced with a mass spectrometer.
- Electrospray produces intact, multiply charged ions of large biomolecules.
- m/z is a dimensionless quantity, so charge state compresses large masses into a modest window.
- UV purity at one wavelength misses non-absorbing impurities and cannot resolve overlapping absorbance.
- Resolving power and mass accuracy are separately defined quantities and are not interconvertible.
- MS response varies by orders of magnitude between peptides at equal concentration, so peak intensity is not an amount.
- Water, counter-ion and inorganic content require separate orthogonal methods.
- Leucine and isoleucine are exactly isobaric; D/L substitution and Asp/isoAsp isomerisation leave mass unchanged.
Open, or commonly asserted without support
- Whether certificates conventionally report monoisotopic or average mass. No standard establishes a convention; check the document.
- Per-analyser ppm accuracy tables. Published figures are sparse and instrument-specific; the 5 ppm criterion above is a method tolerance, not a specification for a class of instrument.
- The mechanism of TFA suppression. The effect is thoroughly documented; the usual ion-pairing explanation was not verified for this guide and is not asserted here.
- The mass at which a monoisotopic peak stops being the most intense. Only the direction of the trend is established.
- Rules predicting charge state from basic-residue count. Frequently repeated, not supported by a source we could read.
Reading an LC-MS line on a certificate
Everything above reduces to a short checklist when a document is in front of you.
- Check that the mass basis is stated. A theoretical mass, an observed mass and the basis used (monoisotopic or average) are three separate pieces of information. All three should be there.
- Check that the deviation is quoted in ppm or Da, not implied by a resolution figure. Resolution tells you what the instrument can separate, not how close the measurement came.
- Treat purity and identity as separate findings. The purity percentage is almost always a UV peak-area figure; our HPLC testing guide explains what that number is and is not, and the COA guide covers the rest of the document.
- Look for a content or assay value if net peptide mass matters to you. An identity confirmation and a purity figure, however good, do not answer it.
- Match the batch. A certificate for a different lot is a specification sheet, not a result for your vial.
- Remember what the powder is. Lyophilized material holds residual water; see what lyophilized means.
Janoshik Analytical certificates are listed by batch on our Lab Testing page, so you can match the batch number on your vial to its report.
See batch reports BPC-157Listing links an HPLC purity and mass-spectrometry identity reportView product
 KPVA tripeptide — small enough that isotope spacing and charge state are easy to readView product
 GHK-CuA metal complex, so its mass depends on peptide-to-copper ratio and salt formView product
 MOTS-cA 16-residue peptide, the size range where multiple charge states are the normView product
Research use only. Pure Peptides Canada products are laboratory reagents for in-vitro research, not for human or veterinary use. This article explains published analytical methods for education; it is not medical, dietary or dosing guidance.
Frequently asked questions
What is LC-MS?
LC-MS is liquid chromatography coupled to mass spectrometry. IUPAC describes a hyphenated mass-spectrometry technique as one in which mass spectrometry is interfaced with a pretreatment step, most often a chromatographic separation. In practice a sample is separated on a liquid-chromatography column and the eluent flows straight into the mass spectrometer, so each species is reported with both a retention time and a mass-to-charge ratio from a single run.
What is the difference between LC-MS and HPLC?
HPLC is the separation on its own, usually with an ultraviolet detector that reports relative peak areas at a single wavelength. LC-MS adds a mass axis to that same separation, so it also reports the mass of whatever eluted. The practical difference is that UV detection cannot identify a peak, cannot see species that do not absorb ultraviolet light, and cannot resolve an impurity whose absorbance overlaps the main peak.
Does a matching mass prove a peptide is the right one?
No. A matching mass constrains the elemental composition, which is strong evidence, but it is not a sequence or stereochemistry proof. Leucine and isoleucine have identical residue masses, so no mass measurement at any resolution separates them. A D-amino-acid substitution leaves the elemental composition unchanged, and aspartate isomerising to isoaspartate does not change the mass either. The honest claim is that the identity is confirmed to the limit of residue mass.
What does LC-MS/MS add?
Tandem mass spectrometry isolates a single ion, fragments it, and measures the masses of the fragments. Because the peptide backbone breaks at predictable points, the fragment masses form a ladder whose consecutive differences are residue masses, which addresses sequence rather than just total mass. The a, b, c and x, y, z naming for those fragments comes from a 1984 letter by Roepstorff and Fohlman, with the convention in current use following Biemann’s 1990 appendix in Methods in Enzymology.
Can LC-MS tell me how much peptide is in a vial?
No, and this is the most consequential limit. LC-MS does not measure water, counter-ions or inorganic residues. A 2020 mass-balance study of synthetic glucagon needed Karl Fischer titration for water, ion chromatography for the trifluoroacetate counter-ion and ICP-MS for inorganic ions alongside LC-MS, and arrived at 896.36 milligrams of peptide per gram against a stated figure of 983.72. If net peptide content matters to your work, look for a separately stated content or assay value.
Is a higher resolution the same as a more accurate mass?
No, they are different quantities. Resolving power is defined by the overlap between two peaks at a stated percentage of peak height, and describes what the instrument can separate. Mass accuracy is the conformity between the measured mass-to-charge ratio and the theoretical value calculated from a proposed formula. A resolution figure such as 120,000 is therefore not an accuracy specification, and high resolving power without calibration does not deliver an accurate mass.
Does trifluoroacetic acid in the mobile phase ruin an LC-MS measurement?
It costs sensitivity rather than ruining the measurement. Signal suppression by trifluoroacetic acid in positive-ion electrospray has been documented since at least 1995, which is why formic acid is often substituted and why mitigation methods exist. Even so, a published peptide quality-control method ran 0.05 per cent trifluoroacetic acid in water and 0.04 per cent in acetonitrile into a high-resolution Orbitrap and confirmed every identity within a 5 ppm tolerance, with a worst-case deviation of 2.4 ppm.
Certificates, listed by batch
Janoshik Analytical certificates are listed by batch on our Lab Testing page. Match the batch number on your vial to its report.
References
- Fenn JB, Mann M, Meng CK, Wong SF, Whitehouse CM. Electrospray ionization for mass spectrometry of large biomolecules. Science. 1989;246(4926):64–71. DOI
- The Royal Swedish Academy of Sciences. The Nobel Prize in Chemistry 2002: press release and prize summary. nobelprize.org
- Dole M, Mack LL, Hines RL, Mobley RC, Ferguson LD, Alice MB. Molecular beams of macroions. J Chem Phys. 1968;49(5):2240–2249. DOI
- Murray KK, Boyd RK, Eberlin MN, Langley GJ, Li L, Naito Y. Definitions of terms relating to mass spectrometry (IUPAC Recommendations 2013). Pure Appl Chem. 2013;85(7):1515–1609. DOI. Individual definitions read at the IUPAC Gold Book: hyphenated mass spectrometric technique, monoisotopic mass, average mass, m/z, collision-induced dissociation and mass resolving power.
- Roepstorff P, Fohlman J. Letter to the editors [proposing a common nomenclature for sequence ions in mass spectra of peptides]. Biomed Mass Spectrom. 1984;11(11):601. DOI
- Biemann K. Appendix 5. Nomenclature for peptide fragment ions (positive ions). Methods Enzymol. 1990;193:886–887. DOI
- Olsen JV, Macek B, Lange O, Makarov A, Horning S, Mann M. Higher-energy C-trap dissociation for peptide modification analysis. Nat Methods. 2007;4(9):709–712. DOI
- Apffel A, Fischer S, Goldberg G, Goodley PC, Kuhlmann FE. Enhanced sensitivity for peptide mapping with electrospray liquid chromatography-mass spectrometry in the presence of signal suppression due to trifluoroacetic acid-containing mobile phases. J Chromatogr A. 1995;712(1):177–190. DOI
- King R, Bonfiglio R, Fernandez-Metzler C, Miller-Stein C, Olah T. Mechanistic investigation of ionization suppression in electrospray ionization. J Am Soc Mass Spectrom. 2000;11(11):942–950. DOI
- Curran TG, Zhang Y, Ma DJ, Sarkaria JN, White FM. MARQUIS: a multiplex method for absolute quantification of peptides and posttranslational modifications. Nat Commun. 2015;6:5924. DOI
- Treutler H, Neumann S. Prediction, detection, and validation of isotope clusters in mass spectrometry data. Metabolites. 2016;6(4):37. DOI
- Cortese M, Gigliobianco MR, Magnoni F, Censi R, Di Martino P. Compensate for or minimize matrix effects? Strategies for overcoming matrix effects in liquid chromatography-mass spectrometry technique: a tutorial review. Molecules. 2020;25(13):3047. DOI
- Wang X, Zhang F, Li H, Xiao P, Su F, Xu B, Sun W, Song D. Purity determination of synthetic glucagon using a mass balance approach. Sci Rep. 2020;10:4423. DOI
- Sikora K, Jaśkiewicz M, Neubauer D, Migoń D, Kamysz W. The role of counter-ions in peptides — an overview. Pharmaceuticals. 2020;13(12):442. DOI
- Deschamps E, Calabrese V, Schmitz I, Hubert-Roux M, Castagnos D, Afonso C. Advances in ultra-high-resolution mass spectrometry for pharmaceutical analysis. Molecules. 2023;28(5):2061. DOI
- Bosc-Bierne G, Ewald S, Kreuzer OJ, Weller MG. Efficient quality control of peptide pools by UHPLC and simultaneous UV and HRMS detection. Separations. 2024;11(5):156. DOI
- Okyem S, Mast DH, Romanova EV, Rubakhin SS, et al., Sweedler JV. Isoaspartate-containing galanin in rat hypothalamus. Commun Chem. 2025;8:72. DOI
- Unimod protein modifications database. Deamidated, accession 7 (delta monoisotopic 0.984016); Oxidation, accession 35 (delta monoisotopic 15.994915). unimod.org
- CIAAW, IUPAC Commission on Isotopic Abundances and Atomic Weights. Carbon: carbon-12 = 12 exactly, carbon-13 = 13.003354835(2) Da. ciaaw.org
- NIST. CODATA 2022 recommended values of the fundamental physical constants: proton mass in u = 1.0072764665789(83). physics.nist.gov
- University of Washington Proteomics Resource. Monoisotopic and average amino acid residue masses. Leucine and isoleucine both 113.084064015; lysine 128.094963050; glutamine 128.058577540; asparagine 114.042927470; aspartate 115.026943065.
For laboratory research use only. Not for human or veterinary use. This article summarizes published analytical methods for educational purposes and is not medical advice.